Trading Solutions
We build tools for traders.
Indicators
We write indicators that give traders a significant advantage in the market. Their role is to help understand the trend, price deviations, candlestick patterns and also to integrate macroeconomic data into our analysis.
Other uses of indicators are to facilitate the assessment of the market situation, turning points, support/resistance zones or market strength. The investor makes decisions based on the indications.
Strategies
We write profitable strategies. On TradingView, the strategy is an advanced version of the indicator that generates buy and sell signals and provides the ability to manage capital.
It is a script written in Pine Script, the effectiveness of which can be checked on historical price data. It generates reports such as: net profit, maximum drawdown, win rate, etc.
Trading Bots
Our ready-made strategies can easily be turned into an automated tool that trades for you. A trading bot is a program that executes buy/sell orders on the market according to the rules specified in the strategy script, without human intervention.
In order for a strategy to become a trading bot, it must be connected to a broker (e.g. via webhooks, API). Trading View allows you to connect to the 80 most popular exchanges and brokers.
Improve your trading
Trading Indicator Based on Envelopes – A Tool for All Traders
Understanding market trends and price movements is crucial for successful trading. Our Envelope-Based Trading Indicator is designed to help both beginners and advanced traders identify their position on the chart with greater clarity. By using dynamic bands that adjust to price fluctuations, this tool provides real-time insights into potential reversals, trend continuations, and overbought or oversold conditions.
How to make trading easy
We provide tools for traders on one of the most popular platform – Tradingview.com
Ready-Made Strategies on TradingView – A Modern Approach to Investing
The investment market is undergoing dynamic changes, with technology playing an increasingly vital role in capital management. TradingView, one of the most popular technical analysis platforms globally, not only allows users to track hundreds of financial instruments but also offers access to ready-made investment strategies that can be successfully used in automated trading. For many […]
Indicators on TradingView – Gaining the Edge Through Technical Precision
In the ever-evolving world of financial markets, access to timely and precise information is a decisive advantage. For active traders, investors, and analysts alike, indicators (or „technical indicators”) are among the most powerful tools available for identifying opportunities and managing risk. TradingView, as one of the most comprehensive platforms for market analysis, offers thousands of […]
For users looking to take full advantage of TradingView’s analytical power, understanding and using Pine Script is a transformative skill. Pine Script is TradingView’s proprietary scripting language, specifically created to help users build custom indicators, alerts, and automated strategies directly within the platform. Unlike general-purpose programming languages, Pine Script is designed with one goal in […]
Trading bots are one of the most revolutionary tools in the modern trader’s arsenal. They are software applications designed to interact with financial markets automatically, executing trades and strategies based on pre-programmed rules and real-time data. While they might sound like futuristic tools for tech-savvy quants, trading bots are increasingly accessible to retail traders through […]
In the fast-paced world of financial markets, automation has emerged as one of the most impactful revolutions in modern trading. What was once the domain of institutional desks and high-frequency hedge funds is now accessible to everyday traders through platforms like TradingView. Automation in trading refers to the use of computer algorithms and systems to […]
Get access to tools
The market is now
working for you
Dodaj tu swój tekst nagłówka
Discover our products
Buy a script for one of the most popular trading platforms – Tradingview.com
How It Works
The indicator utilizes envelopes, a widely used technical analysis tool that consists of two bands surrounding the price.
These bands are calculated based on a moving average, with an adjustable percentage distance that creates an upper and lower boundary. When the price approaches or crosses these boundaries, traders can interpret market conditions and make informed decisions.
The Envelope-Based Trading Indicator is an excellent tool for traders of all levels. It provides clear visual cues about price positioning, making it easier to identify trends, potential reversals, and overbought or oversold conditions.
FuturesOn - Professional trader
Beginners will appreciate its simplicity in understanding market dynamics, while advanced traders can use it as a reliable confirmation tool alongside other indicators.
Monica Blanca - Enthusiast
Its customizable settings allow for flexibility, adapting to different trading strategies.
Ontario_Stock - Trader
Overall, this indicator enhances decision-making and helps traders navigate the markets with greater confidence.
Michael Drein- Adept
For Beginners
The indicator simplifies market analysis by visually guiding traders on price positioning, reducing uncertainty in decision-making.
For Advanced Traders
It serves as a valuable confluence tool when combined with other indicators like RSI, MACD, or volume analysis, enhancing trade accuracy.
Customizable Settings
Users can adjust the envelope parameters to fit different trading styles, whether scalping, day trading, or swing trading.
In Ranging Markets
The price bouncing between the envelopes indicates sideways movement, helping traders identify support and resistance levels.
In Trending Markets
If the price consistently moves near the upper envelope, it signals strong bullish momentum, whereas proximity to the lower envelope suggests a dominant bearish trend.
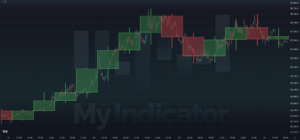
Indicator.my - Multi-Interval Candle Viewer - PRO Version
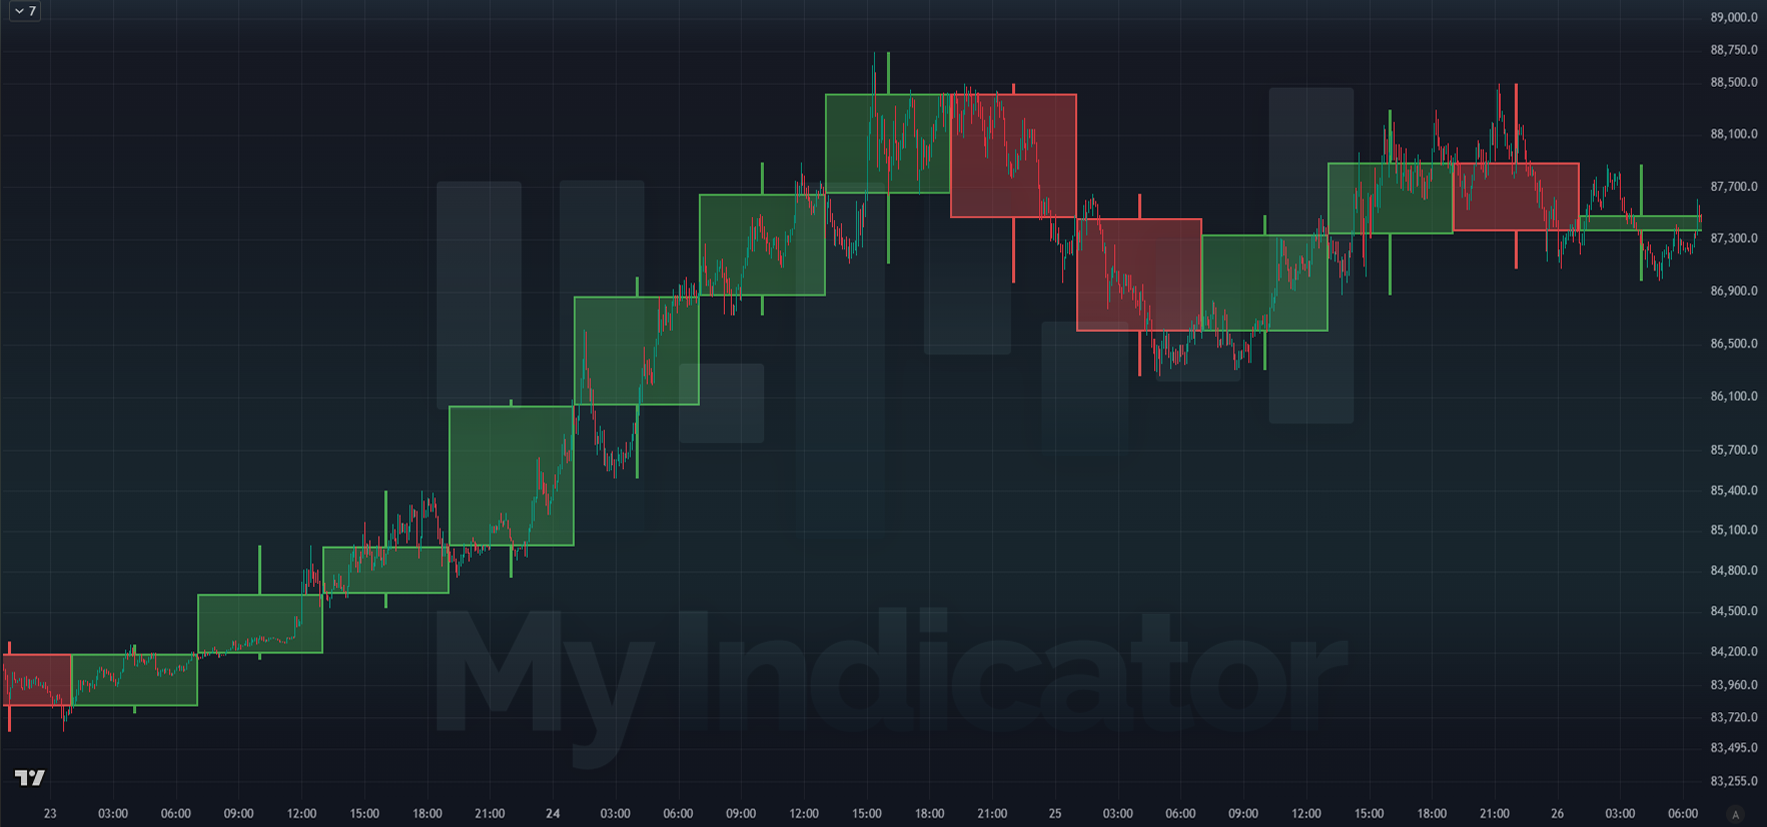
66,00 €
PRO Indicators
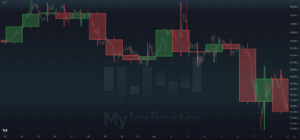
Indicator.my - Multi-Interval Candle Viewer - Demo Version
0,00 €
Free Indicators
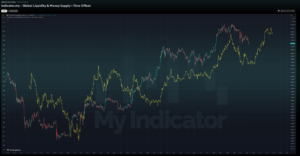
Global Liquidity & Money Supply M2 + Time Offset
0,00 €
Free Indicators
You'll love it
Discover the greatest advantages of the unrivaled tool
Less Trades More Wins
And much more peace of mind
Have you ever heard that less is more? The strategy allows for opening positions only at the most statistically certain moments. Signals are triggered rarely, which means that the algorithm only hits the best opportunities. This way, you reduce the risk in the chaotic price movement that is difficult to tame. Fewer transactions also means fewer fees for the stock exchange or broker.
Above-average rate of return
With no stress
In less than 4 years, calculated using the „Strategy Tester” tool by Tradingview, above-average return on investment of almost 260% was achieved using a leverage of 4.25x. When you do not use leverage and play only with your own capital, the rate of return for the given period is 60.89%!
Easy to modify settings
Just two clicks
Although the strategy has implemented the most optimal settings that give you the greatest possible advantage, if you want to experiment with the settings, you can easily modify them at any time.
About Autor
12 years of experience in the capital market. During this time, he devoted himself to intensive study of charts, analyzing and improving his own investment strategies. Thanks to systematic observation and deepening knowledge in the field of technical analysis and the crypto market, he developed the ability to see the relationships that are responsible for the formation and dynamics of the price. His approach is based on independent experimentation and constant striving to understand complex financial processes. Today, he shares his achievements with the world using Indicator.my tools.
Site Map
Learn how to deploy automated strategies
Discover all our trading solutions
Information about the risks associated with investing