

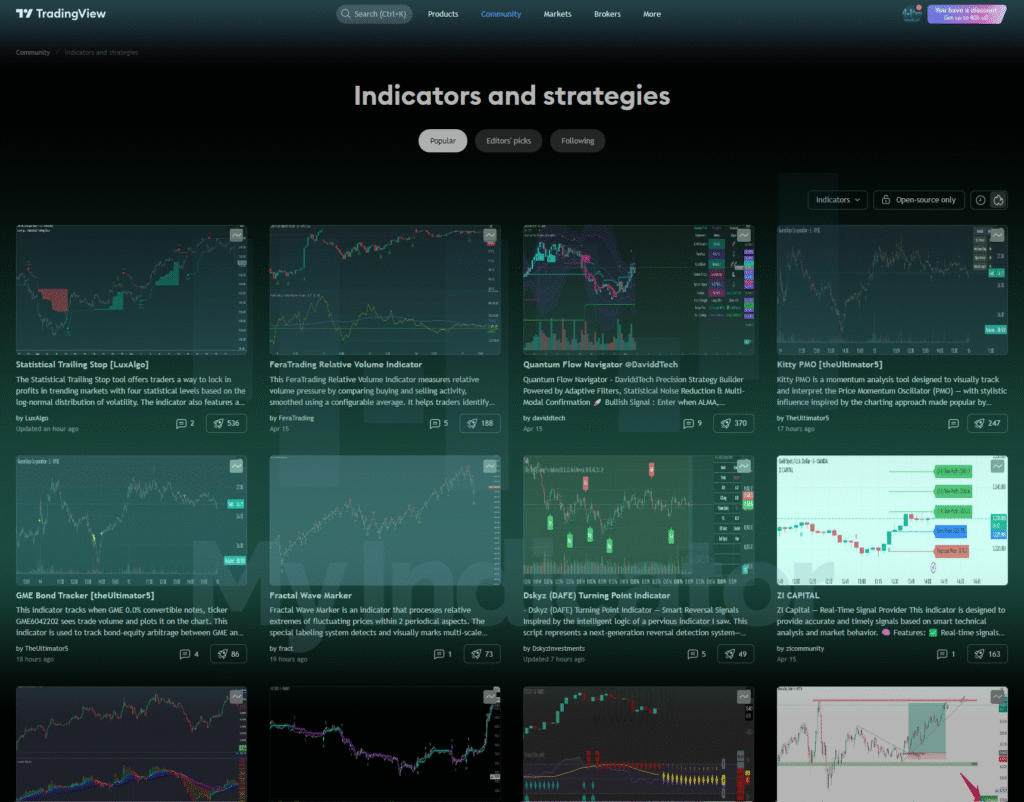
Indicators on TradingView – Gaining the Edge Through Technical Precision
In the ever-evolving world of financial markets, access to timely and precise information is a decisive advantage. For active traders, investors, and analysts alike, indicators (or „technical indicators”) are among the most powerful tools available for identifying opportunities and managing risk. TradingView, as one of the most comprehensive platforms for market analysis, offers thousands of indicators-both built-in and custom-made-designed to empower users at every level of experience.
By leveraging indicators effectively, traders can transform uncertainty into strategy. Rather than reacting emotionally to market noise, they gain the ability to operate based on logic, probability, and repeatable methods. In fast-moving markets, this ability to base decisions on structured analysis can be the difference between success and frustration.
What Are Indicators and Why Are They Important?
Indicators are mathematical formulas applied to price, volume, or open interest data. Their role is to extract trends, patterns, and signals that may not be immediately visible on a raw price chart. By doing so, indicators help traders answer critical questions: Is the market trending? Is it overbought or oversold? Is a reversal imminent?
Indicators interpret market behavior into readable visual outputs-curves, bands, lines, histograms-that guide traders in making informed decisions. They bridge the gap between raw data and actionable insight, converting the chaotic movements of price into meaningful structures.
On TradingView, indicators play a central role in the analytical process. They allow users to confirm hypotheses, refine entry and exit points, and design entire trading systems based on quantifiable signals rather than gut feeling or guesswork. This objectivity provides traders with greater discipline, and often leads to more consistent results over time.
Beyond just charting, indicators also serve educational purposes. By observing how different indicators react to market movements, users learn the mechanics of price action, trend dynamics, and volatility-all critical skills in mastering the markets.
Main Types of Indicators
Technical indicators can be broadly categorized into several groups, each serving a specific function. Understanding their distinct purposes is essential to building a reliable trading toolkit:
Trend-following indicators: These help identify the direction and strength of the prevailing market trend. Moving Averages (MA) smooth out price data to reveal underlying direction. MACD shows convergence or divergence between short- and long-term momentum. Parabolic SAR assists in determining potential reversals. Trend indicators are essential for position traders and those looking to trade in the direction of momentum.
Momentum indicators: These measure the speed at which prices are moving. Tools like RSI and the Stochastic Oscillator help identify when an asset might be overbought or oversold, indicating a possible correction. These indicators are especially useful in ranging markets where momentum tends to reverse frequently.
Volatility indicators: Volatility is a key measure of risk and opportunity. Bollinger Bands contract and expand based on market volatility, helping identify breakouts or consolidations. ATR quantifies average price movement, informing traders how far an asset might move and assisting with position sizing.
Volume-based indicators: Volume validates price action. On-Balance Volume (OBV) and Volume Profile show how volume changes support or contradict price trends. High volume confirms price direction, while divergence may suggest weakening momentum.
Custom/premium indicators: Built by experienced developers, these tools incorporate multiple data points, algorithms, or logic layers to create unique, proprietary insights. They are often protected or available only to paying users, offering a distinct edge.
Each indicator type serves a role in different market conditions. Trend tools help during trending phases, while oscillators shine in consolidation. A good trader learns which to use-and when.
Practical Applications and Strategic Use
The true power of indicators lies in how they are used. No single indicator provides all the answers. Instead, skilled traders combine multiple indicators to confirm signals and filter out noise. For instance, a trader may use a moving average to identify the trend, RSI to detect overbought/oversold conditions, and ATR to size their position accordingly.
This process of combining indicators is known as confluence-a cornerstone of high-probability trading. When several indicators align, the likelihood of a successful trade increases. Conversely, when indicators diverge, caution is warranted.
On TradingView, these indicators can be layered and customized to suit specific strategies. The platform’s scripting capabilities via Pine Script give users the ability to fine-tune existing indicators or build custom ones from scratch. This is particularly valuable for institutional users, quant traders, or anyone seeking to codify their edge.
Moreover, users can set real-time alerts based on indicator conditions. For example, an alert can notify you when RSI crosses a specific threshold, or when price touches an upper Bollinger Band. This automation enhances efficiency and responsiveness.
Advanced traders often develop entire rule-based systems using indicators as building blocks. These systems can be visually tested, backtested, and iteratively improved-all within TradingView’s ecosystem.
Why Use Premium or Verified Indicators?
While TradingView’s free library is vast and growing, some of the most effective and consistent tools are hidden behind private access or require a subscription. Premium indicators are not just about exclusivity-they offer a level of refinement and research rarely found in open-source scripts.
Exclusivity: Since fewer traders use these tools, their signals remain more effective. Unlike common indicators where usage is widespread and thus predictable, premium scripts preserve a degree of edge.
Proven performance: Many paid indicators come with extensive documentation, performance history, and transparent logic. They are often stress-tested across various market conditions and assets.
Advanced logic: Professional developers incorporate layers of logic, filters, and analytics that go beyond what standard indicators provide. This might include dynamic stop-loss levels, multiple timeframe validation, or probabilistic entry zones.
Ongoing support: Buyers of premium indicators often receive updates as market conditions change, and they can communicate directly with the developers for insights and adjustments.
In a market where information is ubiquitous but quality insight is scarce, investing in a well-built premium indicator can give traders a meaningful advantage. It’s not just a tool-it’s a strategic asset.
How to Add Our Indicators to Your TradingView
To start using our custom indicators on TradingView, follow these simple steps:
Visit our website – Explore the list of available indicators, view sample charts, and performance breakdowns. Our platform is designed to help you choose tools that align with your trading goals and style.
Choose your tool – Select the indicator(s) that best align with your trading strategy. Whether you’re a scalper, swing trader, or long-term investor, we provide tailored solutions for each profile.
Purchase access – Once your order is complete, simply provide us with your TradingView username. We’ll grant you invite-only access directly through the TradingView system.
Open TradingView – Launch a chart, click on the “Indicators” button, and navigate to the “Invite-only scripts” tab. You’ll see your new indicator(s) listed there.
Add and customize – Begin integrating the indicator into your workflow. Adjust settings, enable alerts, and combine it with other tools to maximize its potential.
Our team remains available to help with installation, usage, and strategy alignment. We believe in building lasting relationships with our users through transparency and ongoing support.
Professional trading demands precision. Indicators especially when thoughtfully selected and skillfully applied—can be the difference between randomness and edge. On TradingView, this power is now more accessible than ever before.